Use and Configure Observability Views
The UXP Web UI includes built-in observability views that help you quickly triage issues in your control plane. The dashboard combines resource state with time-series metrics in one place.
Time-series metrics require a Standard license. Community edition users can access resource and package state views.
Observability views help with quick fault attribution, not as a replacement for external monitoring stacks.
Observability views can help:
- Identify failing resources. Quickly assess resource health and filter unready resources.
- Troubleshoot control plane issues. Check reconcile rates and API call volumes to validate the scope of an issue.
- Track function performance. Check function execution latency and find slow or failing functions.
For long-term retention, alerting, and deep analysis, use an external monitoring stack (Grafana, Datadog, etc).
Available data
The observability dashboard displays data from two sources:
-
Resource and Package State (QueryAPI)
- Resource health chart provides a count of resources by Ready condition
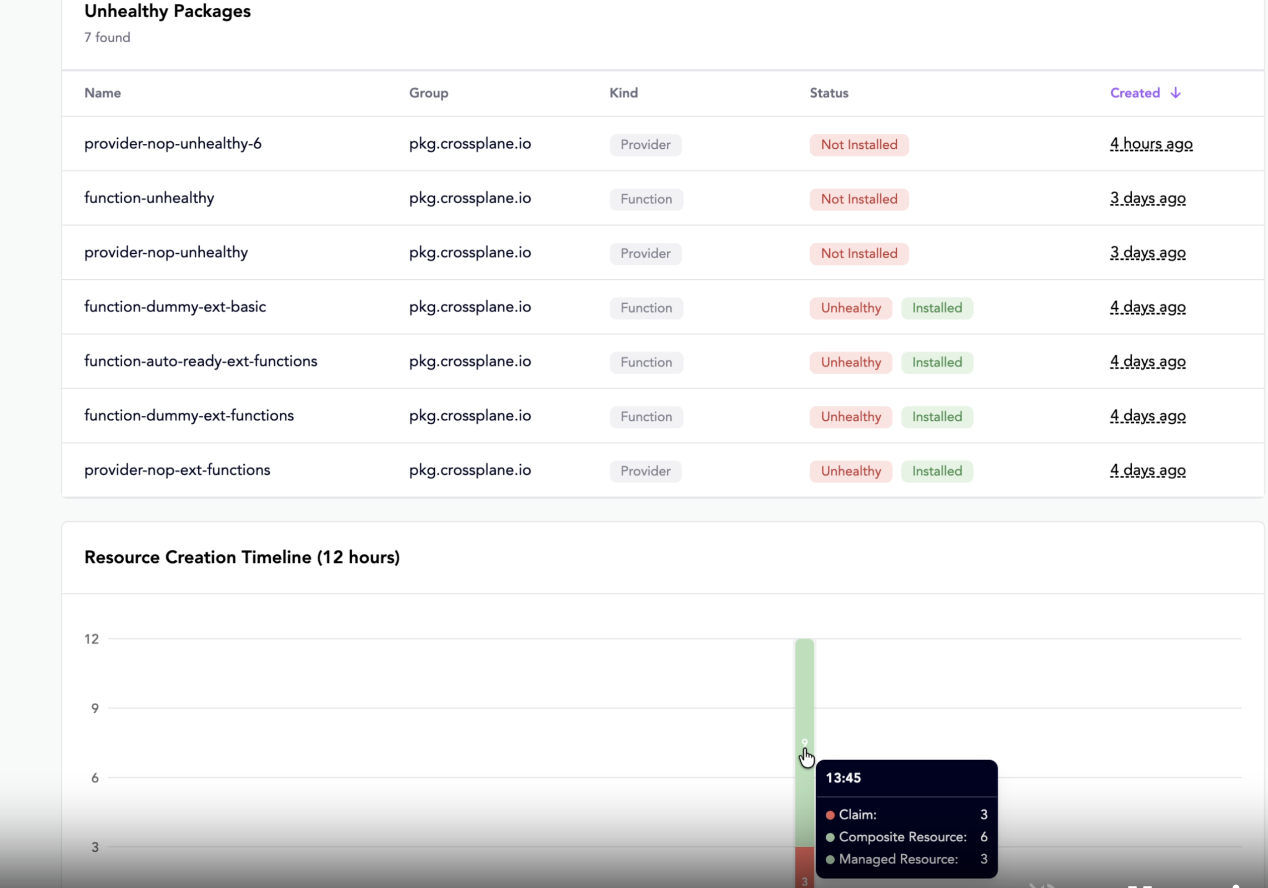
- Package health chart provides a count of providers, functions, and configurations by health status
- Not Ready resources table filters and inspects resources that aren't healthy
- Resource creation timeline allow you to see when resources were created over time
-
Time-Series Metrics (Prometheus, Standard editions only)
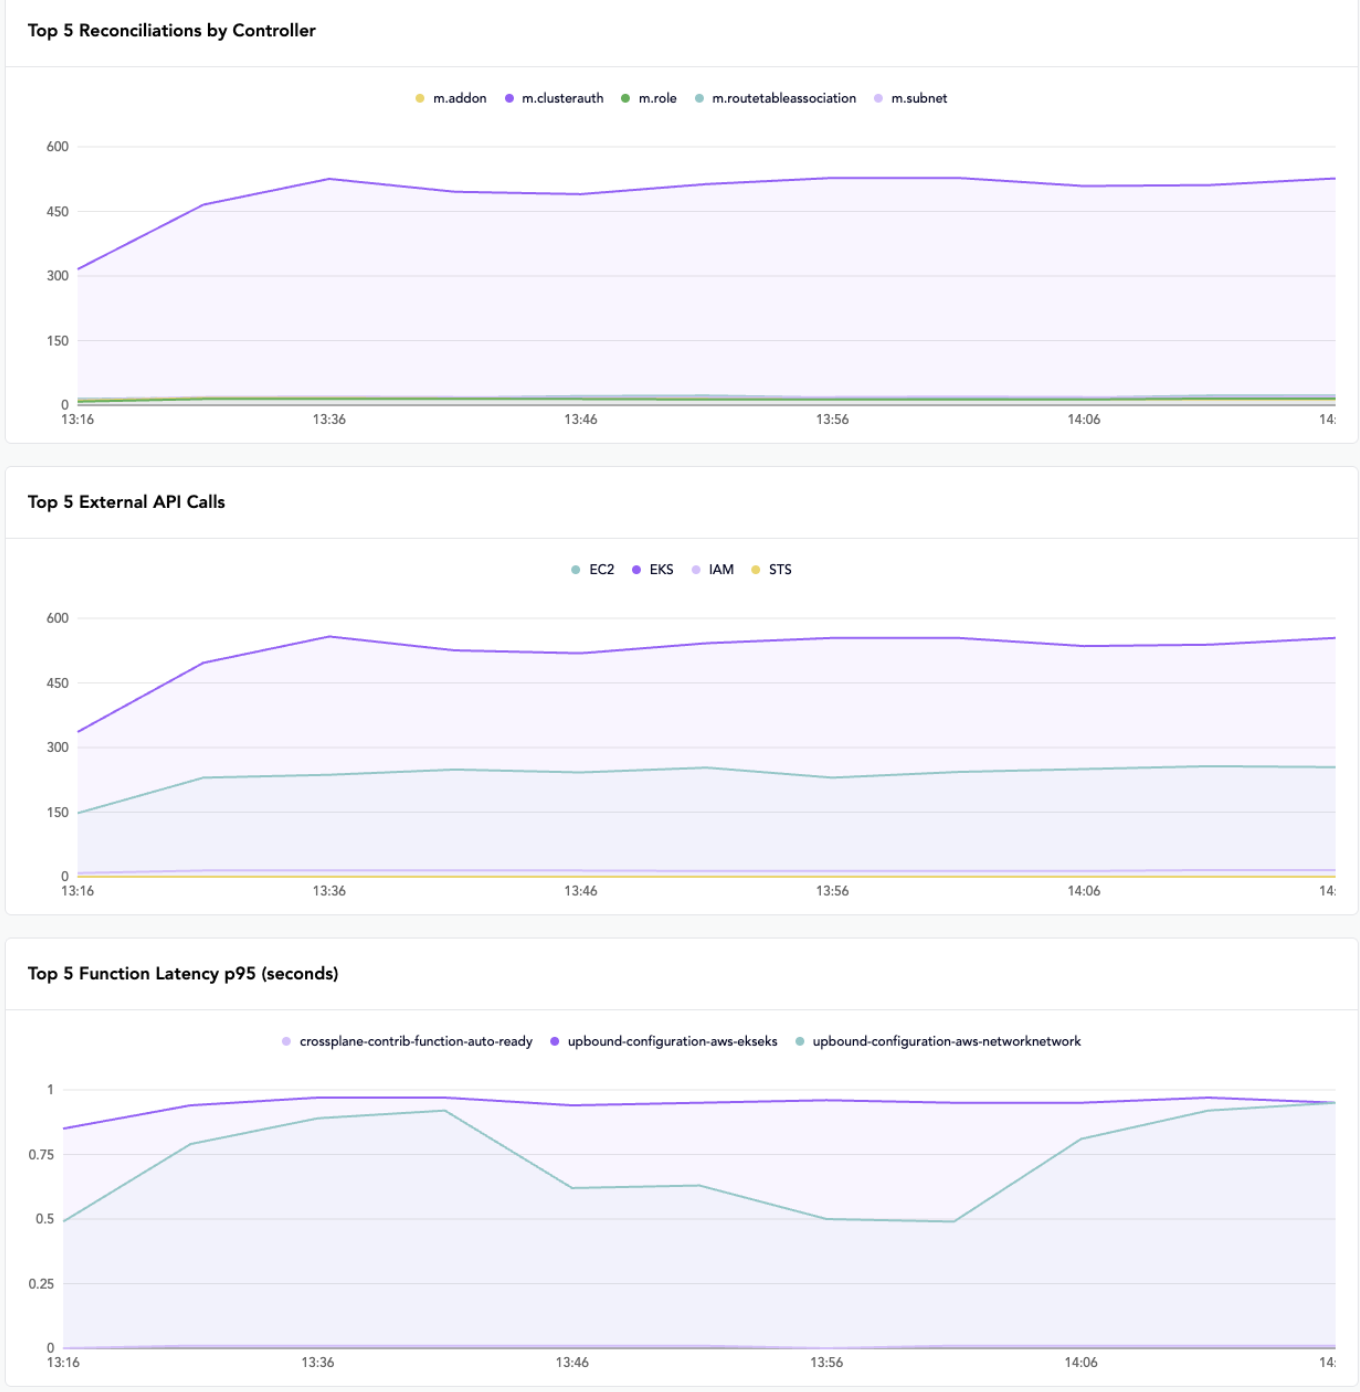
- Reconciliation metrics provides reconciliation rates per controller to identify stuck or overloaded controllers
- External API calls captures the volume of API calls per resource kind to spot providers under heavy load. This metric is only available for provider-aws—other upjet-based providers (Azure, GCP) don't emit
upjet_resource_external_api_calls_total. - Function latency provides function execution times to identify performance issues
Resources and packages at a glance
The Web UI dashboard provides a quick look at your control plane resources:
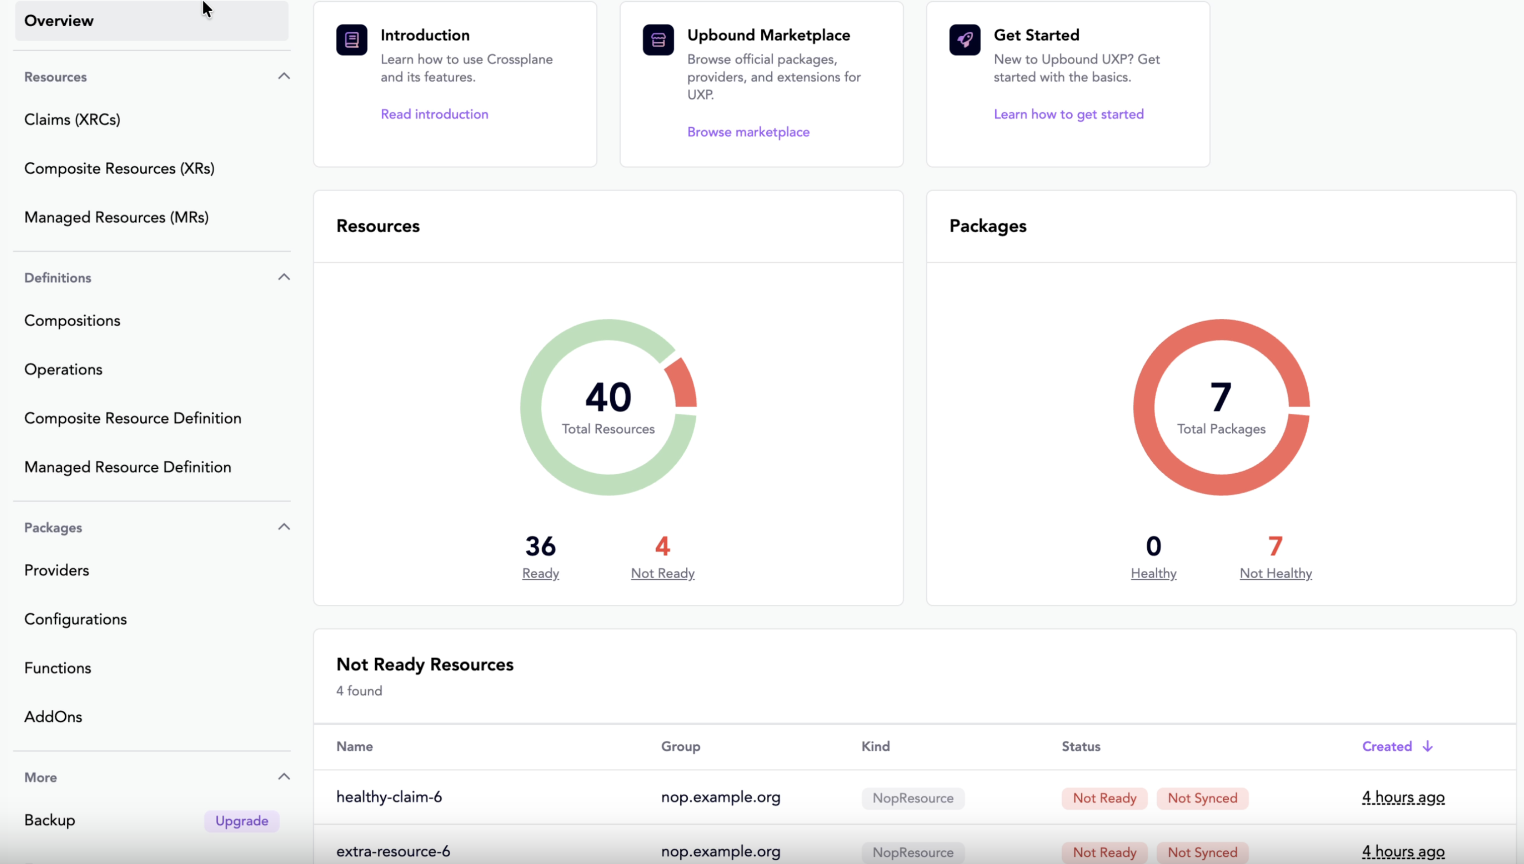
Package health
You can click into these views to see more information:
Additional metrics
Feature availability
Observability features vary by edition:
| Feature | Community | Standard |
|---|---|---|
| Resource health chart | ✓ | ✓ |
| Package health chart | ✓ | ✓ |
| Not Ready resources table | ✓ | ✓ |
| Resource creation timeline | ✗ | ✓ |
| Reconciliation metrics charts | ✗ | ✓ |
| External API call charts | ✗ | ✓ |
| Function latency charts | ✗ | ✓ |
Prometheus
UXP deploys a lightweight Prometheus instance for Standard license deployments to power the metrics charts. It's preconfigured with 12-hour retention and metric filtering that keeps only what the dashboard needs.
Bring your own Prometheus
If you already run your own Prometheus, disable the built-in instance and point the dashboard at yours through Helm values:
webui:
  config:
    metricsApiEndpoint: 'http://your-prometheus:9090/api/v1'
Your Prometheus needs to scrape UXP components and have these metrics available:
controller_runtime_reconcile_totalupjet_resource_external_api_calls_total—emitted by provider-aws only; Azure and GCP upjet-based providers don't support this metric.function_run_function_seconds_bucket,_sum,_count