Upbound Console
This feature is available in the Standard Plan and above. For more information, see our pricing plans or contact our sales team.
Upbound's Console is the command and control center for users to operate their organization's internal cloud platforms. The Console consolidates management of your internal cloud platforms under a single pane of glass. You can view usage and logs, debug control plane operations, and more across all your control planes.
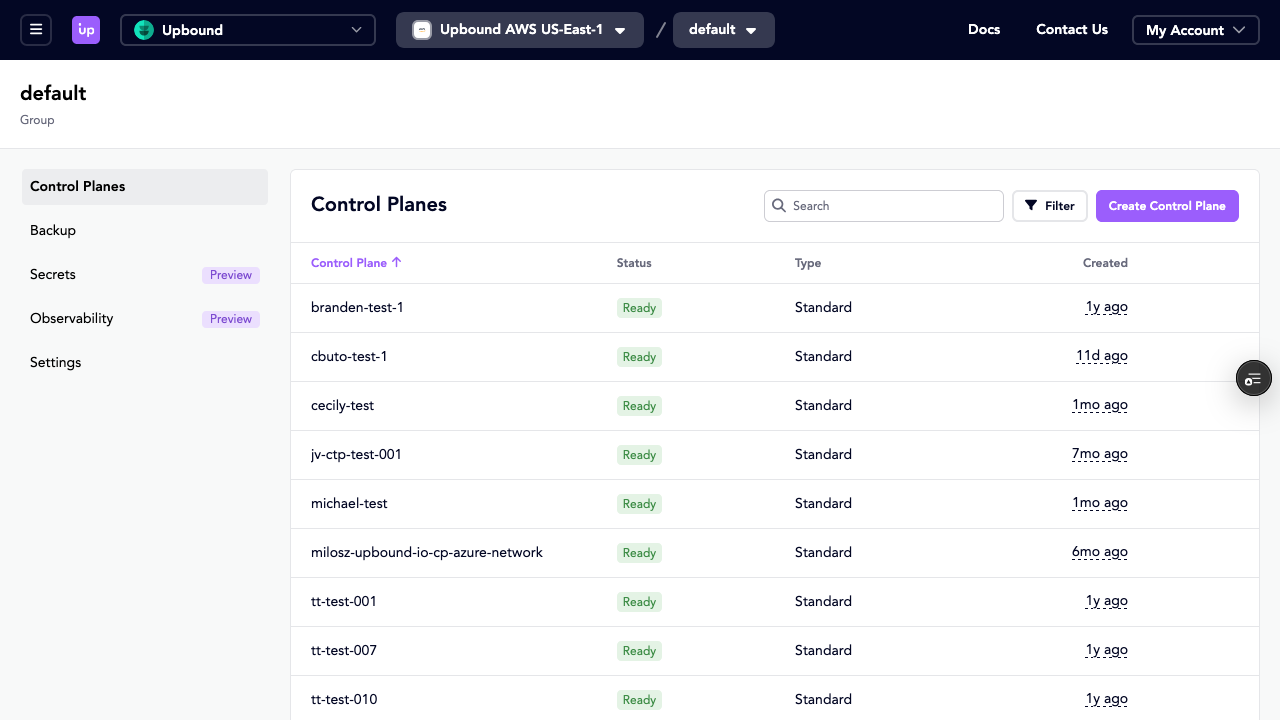
Dashboard
The default landing page for the Console is the control plane dashboard. On the dashboard is a table view of your control planes showing key details such as name, status, configuration version, and creation date. You can search the table by control plane name to filter down the table.
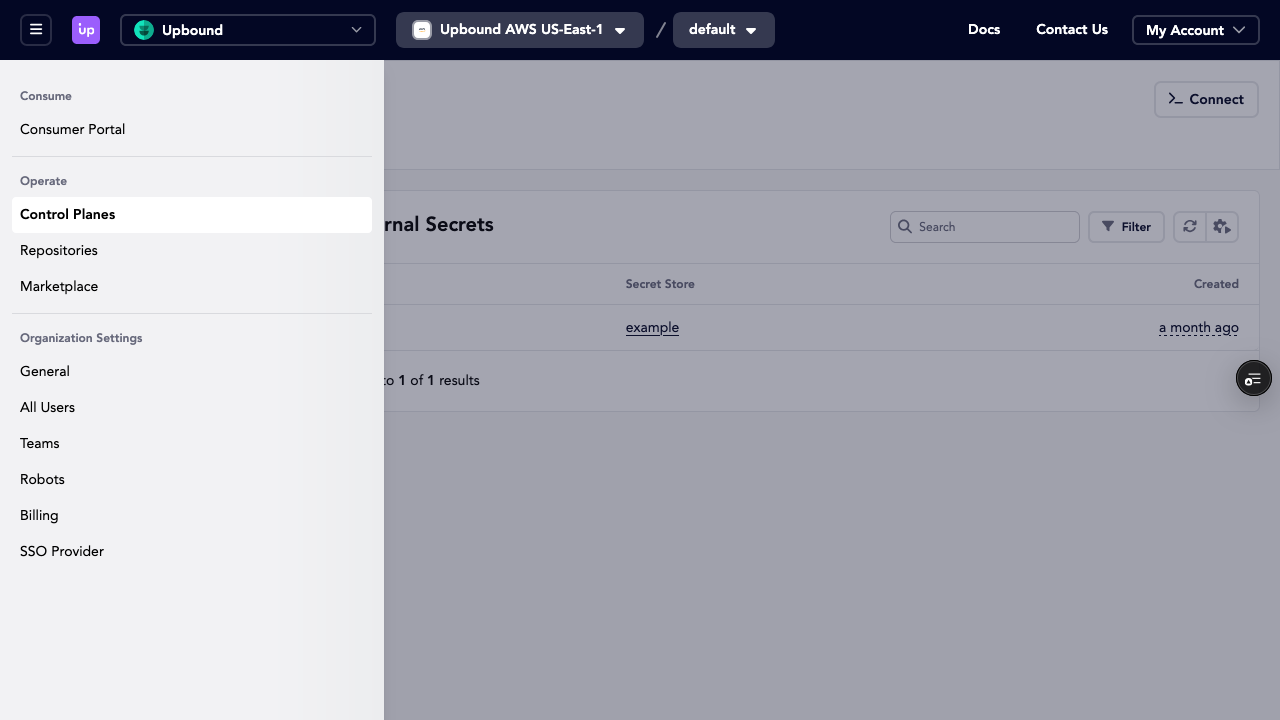
Above the dashboard is Upbound's top navigation bar. Wherever you are in the product, the navigation bar allows you to access:
- Control plane dashboard
- Configurations list
- Organization settings and management
- Help and documentation
- the Upbound Marketplace
- Account management and an org picker (if you belong to several organizations)
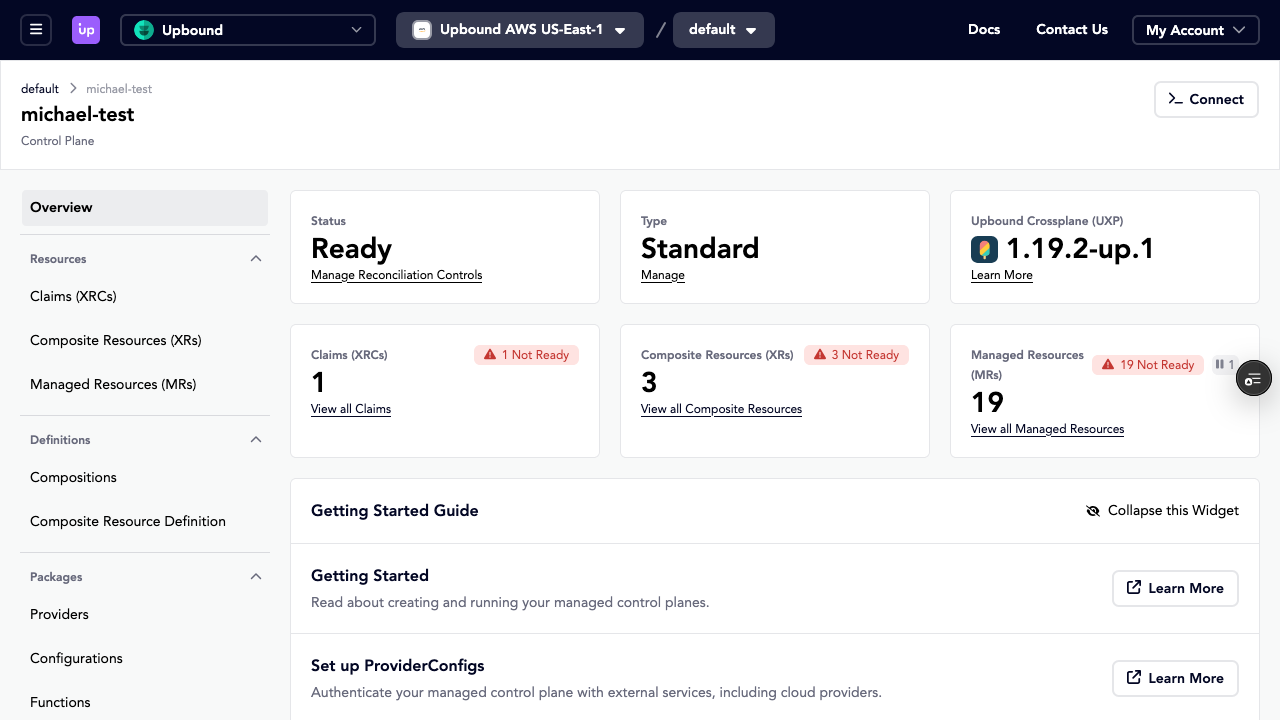
Control Plane Explorer
Clicking into a control plane brings you to the control plane explorer. From the control plane explorer you can learn how to integrate the control plane.
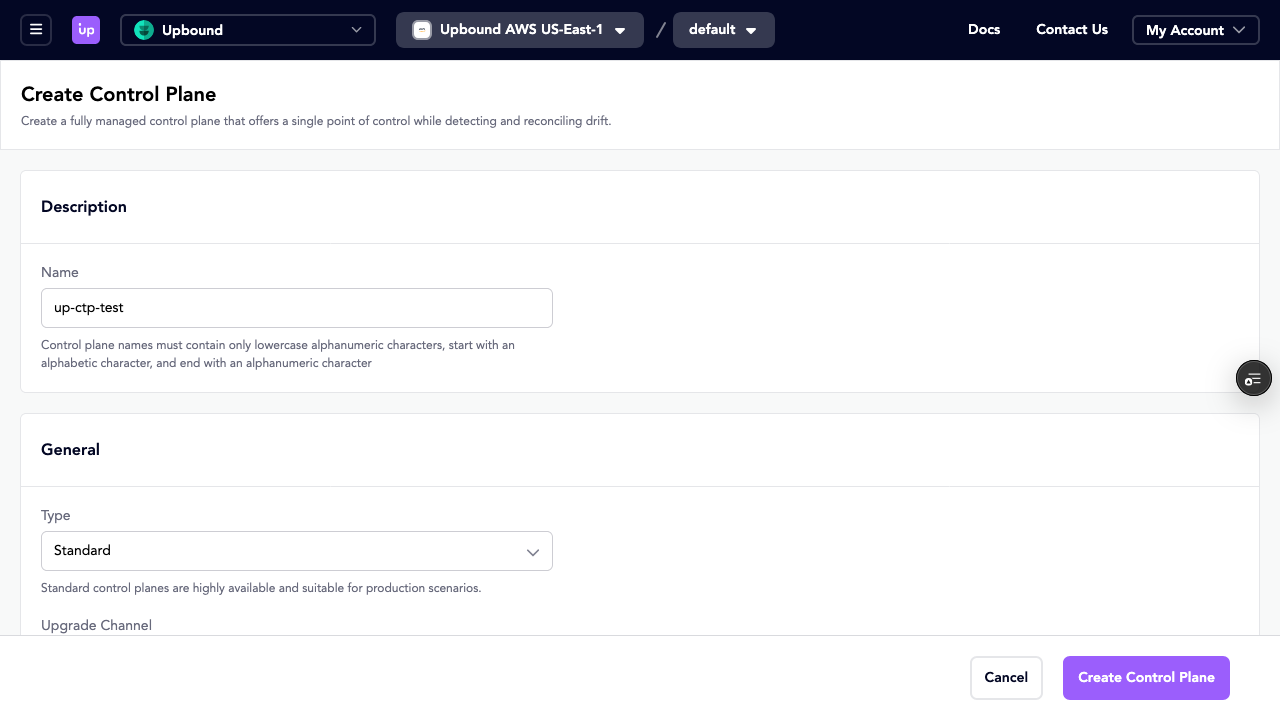
Control plane and configuration creation
You can create new control planes from the dashboard.
Creating a new control plane from the Console:
Resource structure
Control plane resource URLs follow this pattern:
/<YOUR_ORGANIZATION_NAME>/spaces/<YOUR_SPACE_NAME>/groups/<YOUR_GROUP_NAME>/controlPlanes/<YOUR_CONTROL_PLANE_NAME>/definitions/<RESOURCE_TYPE>
For example, to view a composition in a specific control plane:
/upbound/spaces/upbound-aws-us-east-1/groups/default/controlPlanes/upbound:upbound-aws-us-east-1:default:ctp-test/definitions/composition
Resource-specific URLs have changed from the previous Console experience. Old bookmarks and deep links to specific resources may not work. Use the Console interface to navigate or search for resources.
Graph and list views
For Claims (XRCs), Composite Resources (XRs), and Managed Resources (MRs), you
can toggle between a list view and graph view using the toolbar.
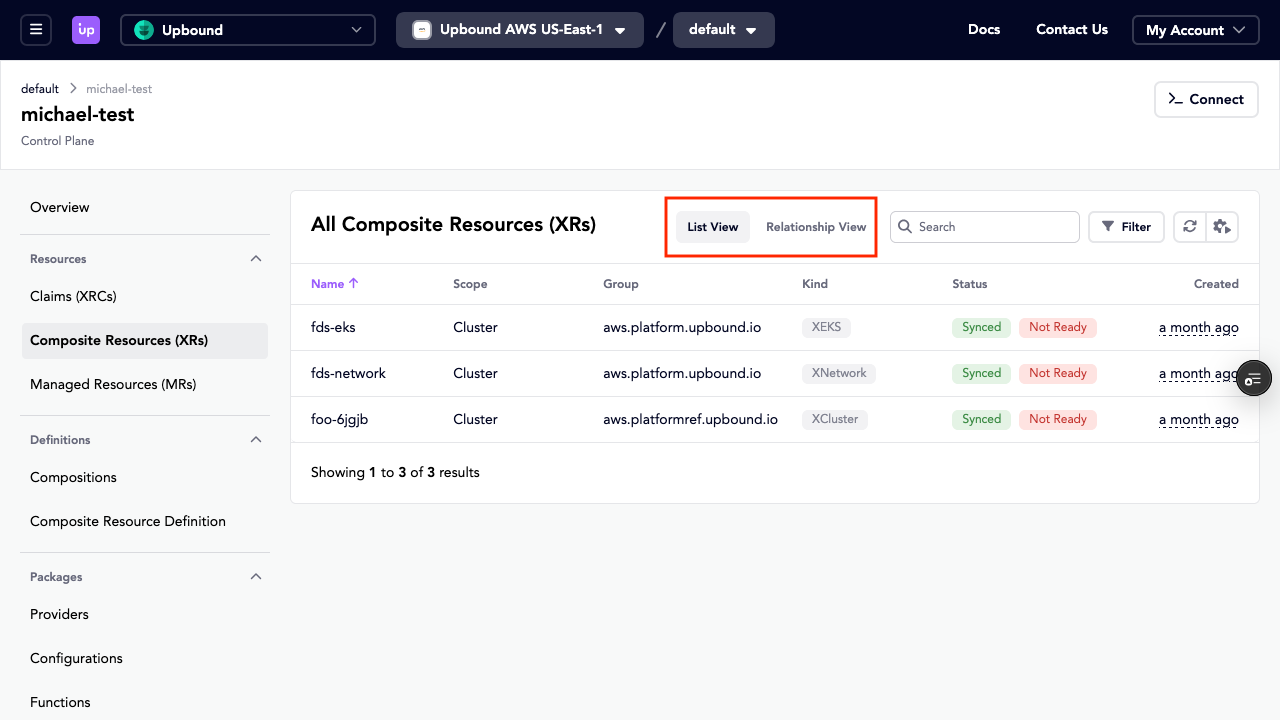
The graph view displays all resources of the selected type and shows their relationships visually. Click on any resource tile in the graph to open a detail drawer.
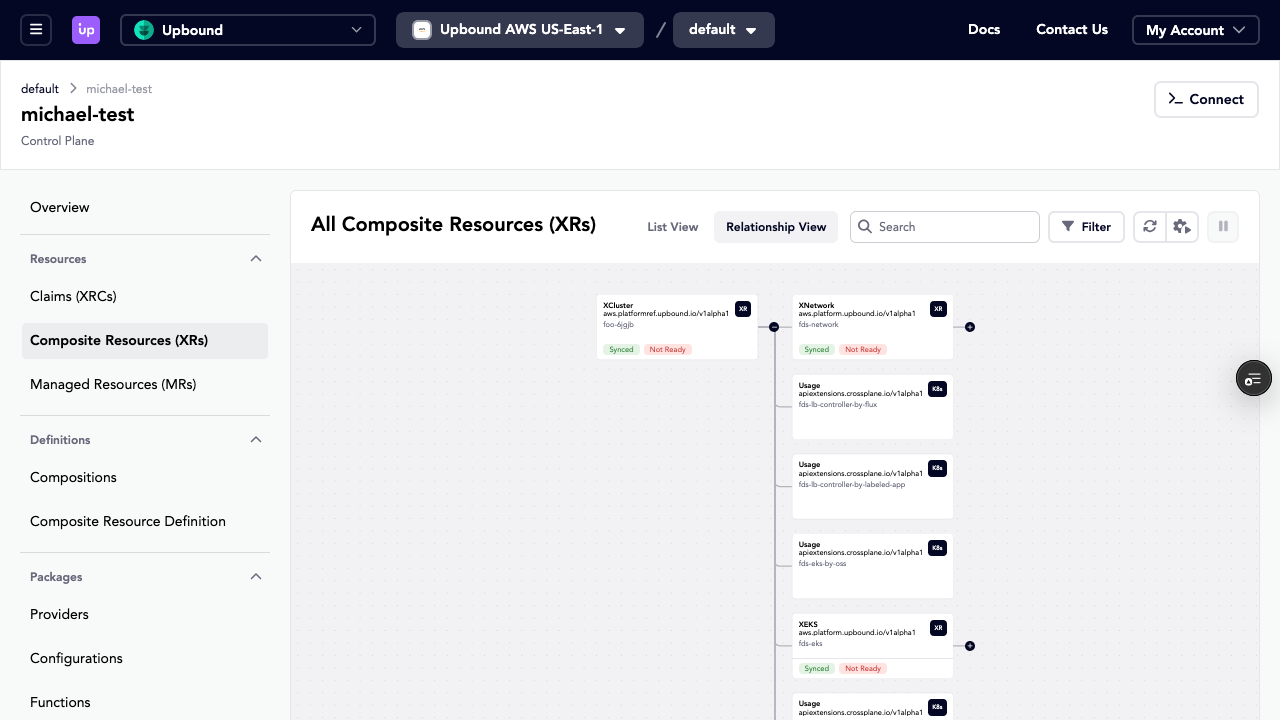
The graph view doesn't update automatically with real-time changes. Use the refresh button to reload the graph with current data.
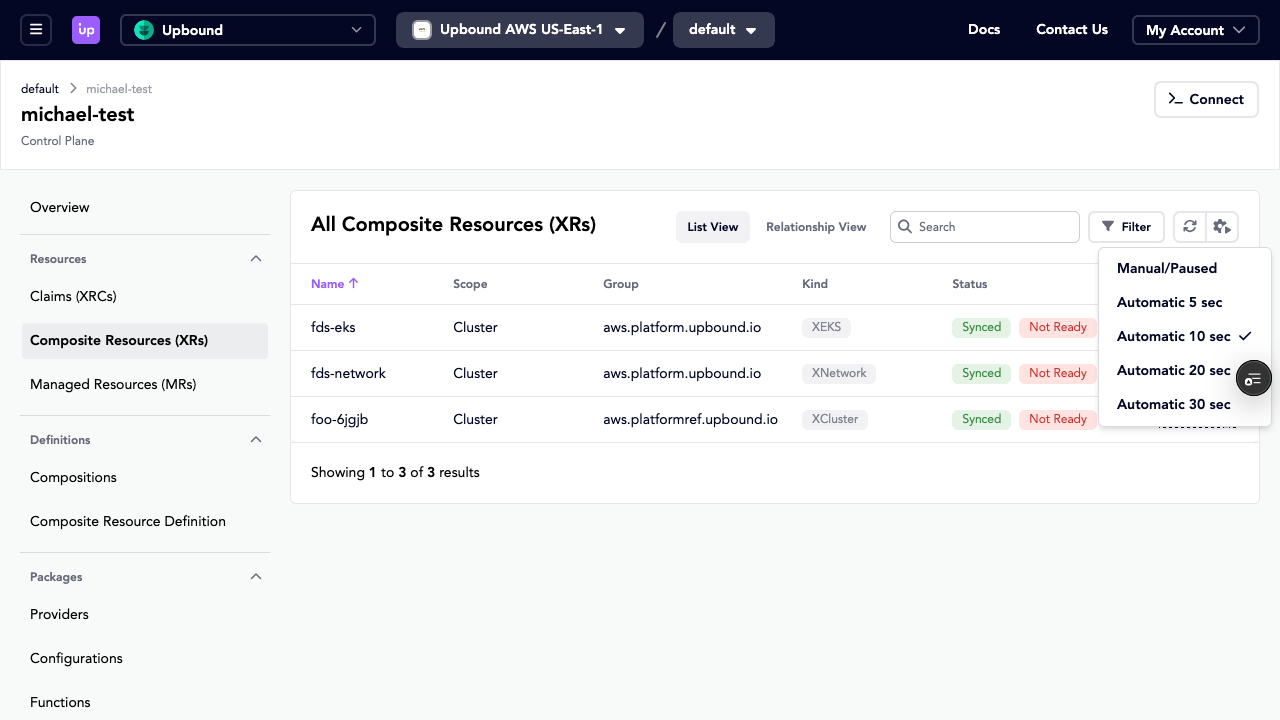
List views include refresh controls in the header. You can:
- Refresh manually
- Set an auto refresh interval
- Pause auto refresh
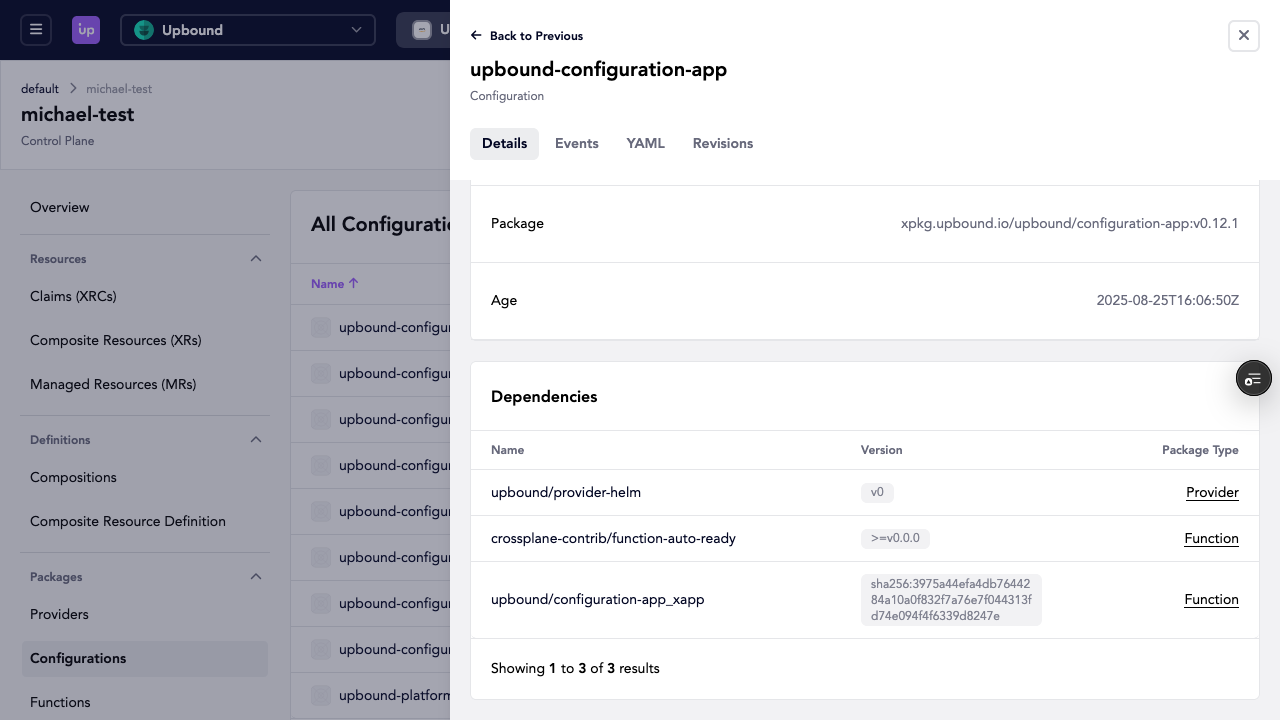
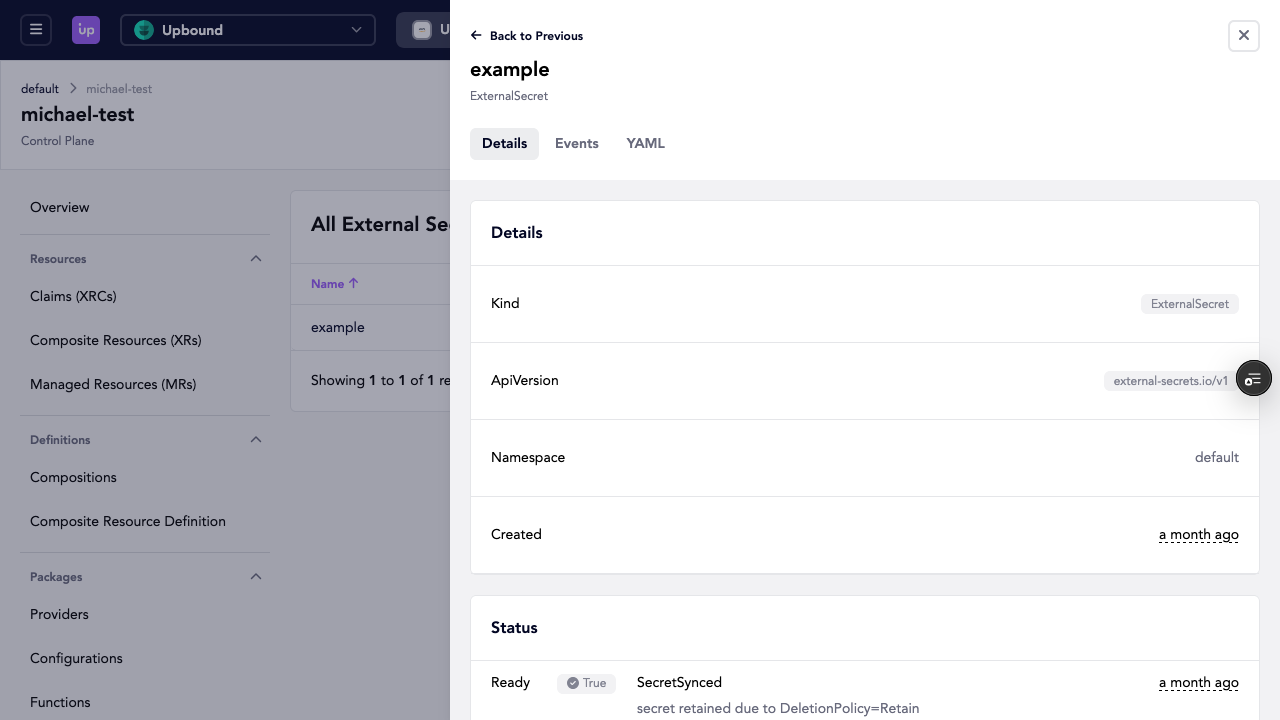
Resource details
When you open a resource, the console displays:
- Details: Kind, API Version, created date, and scope
- Status: List of status conditions and timestamps with messages
- Printer Columns: Kubernetes
additionalPrinterColumnsdata - Events: Events related to the resource with optional filters
- YAML: Resource definition
- Referenced By: Resources that reference this resource
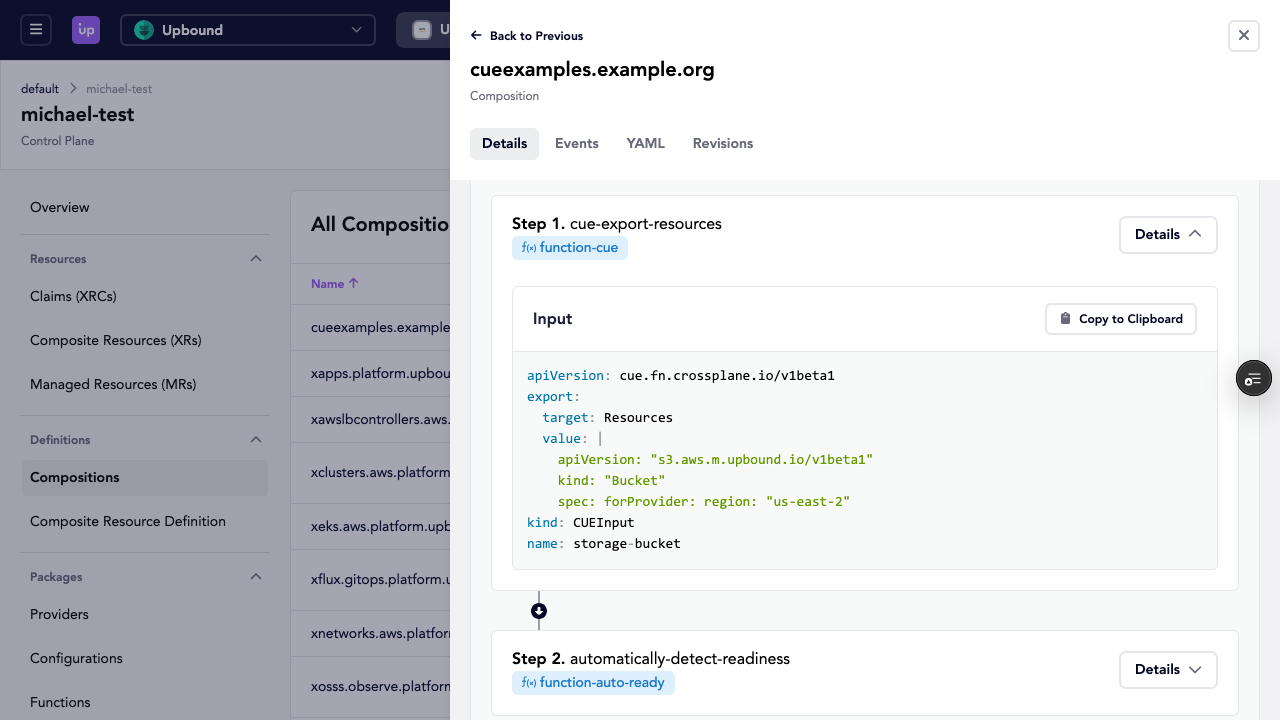
Pipeline view
Compositions, Composition Revisions, Functions, and Function Revisions include a details drawer with a Pipeline section. This shows the ordered steps that execute, including step names and associated resources or functions.
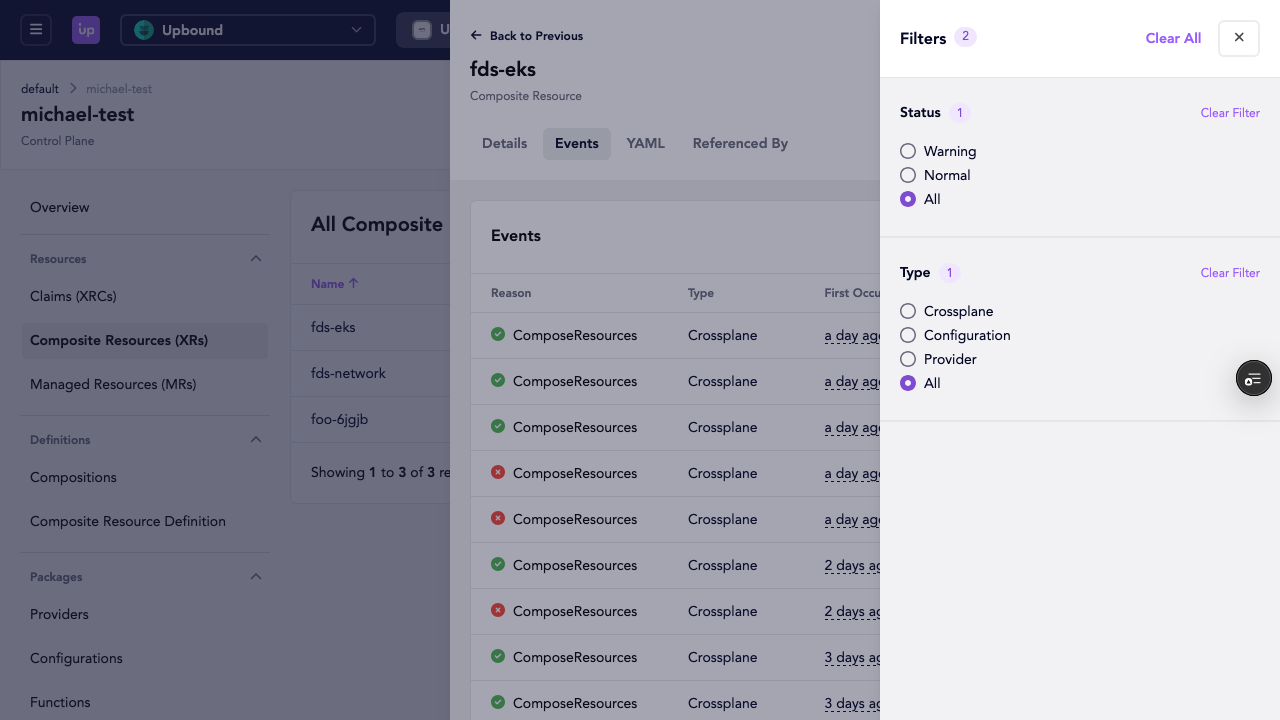
Events
Use the Events tab to filter for specific information in your control plane.
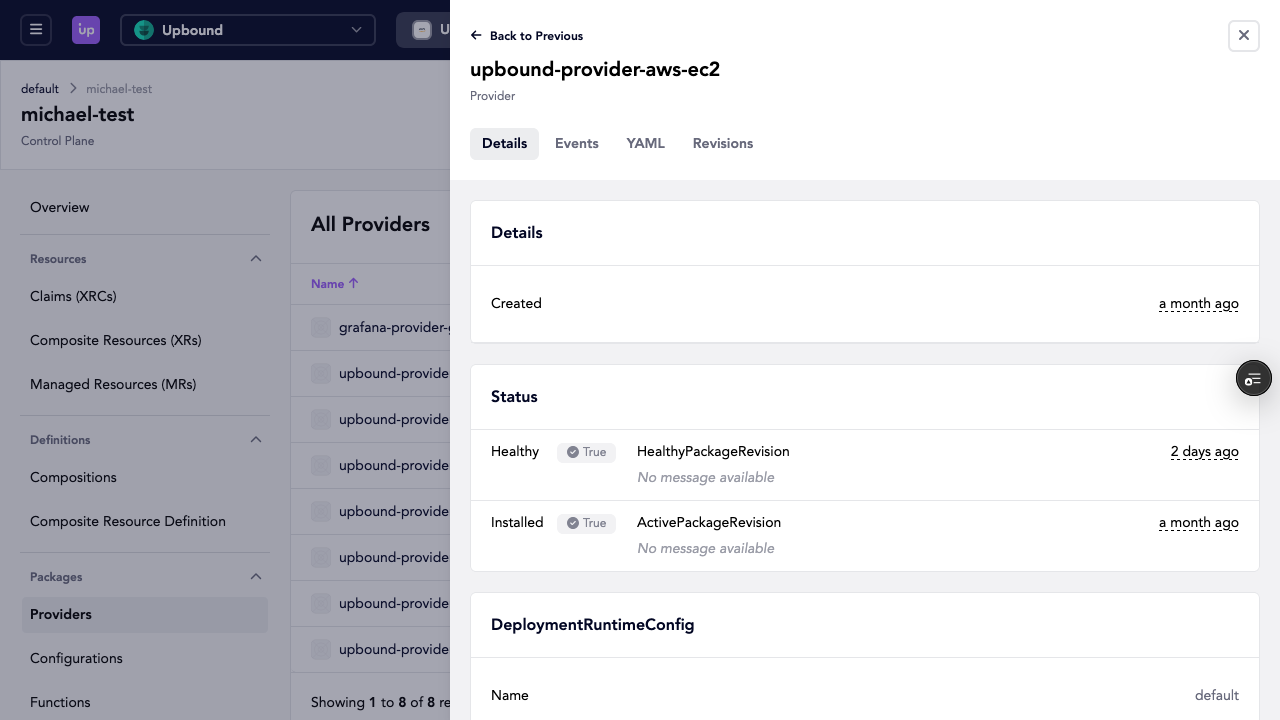
Provider configurations
The Console displays Provider Configurations in a read-only list view. The Console doesn't provide interfaces to create, update, or delete Provider Configurations.
To manage your Provider Configurations, use kubectl and refer to the
ProviderConfig documentation.
Secrets
The updated Secrets view displays External Secrets in a table format showing the secret name, secret store, and creation date.
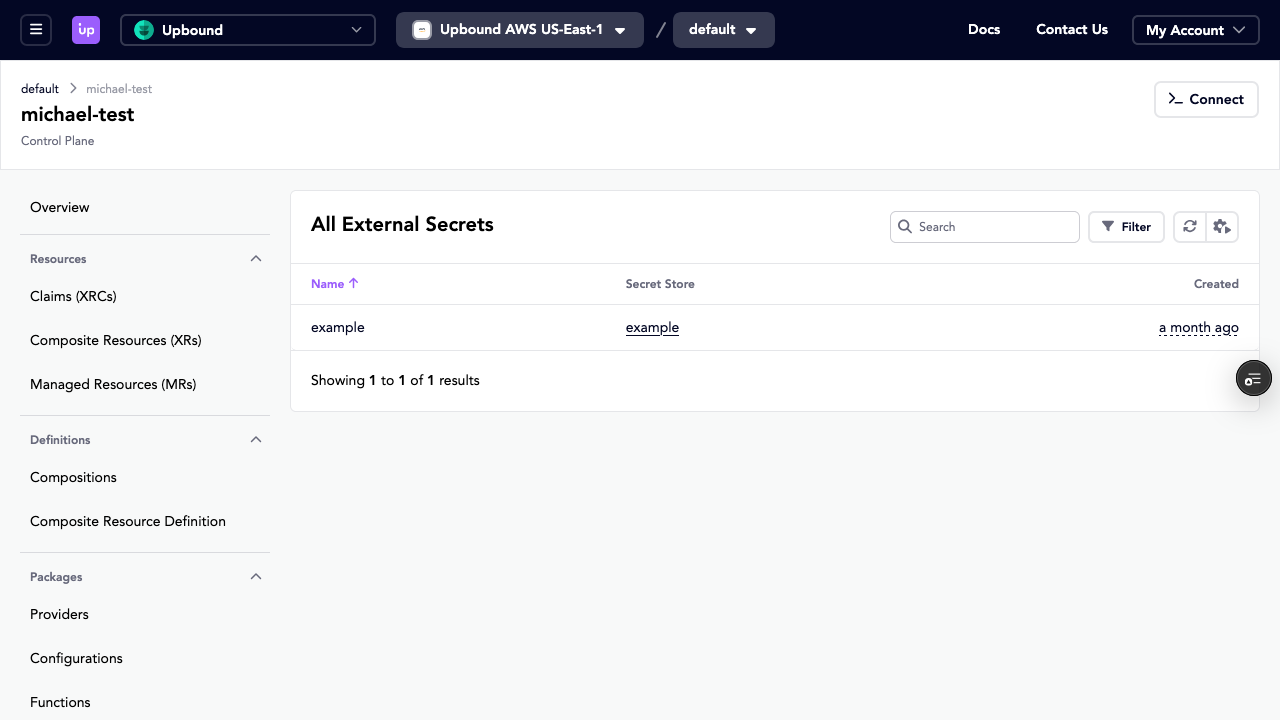
You can select the secret for more information.
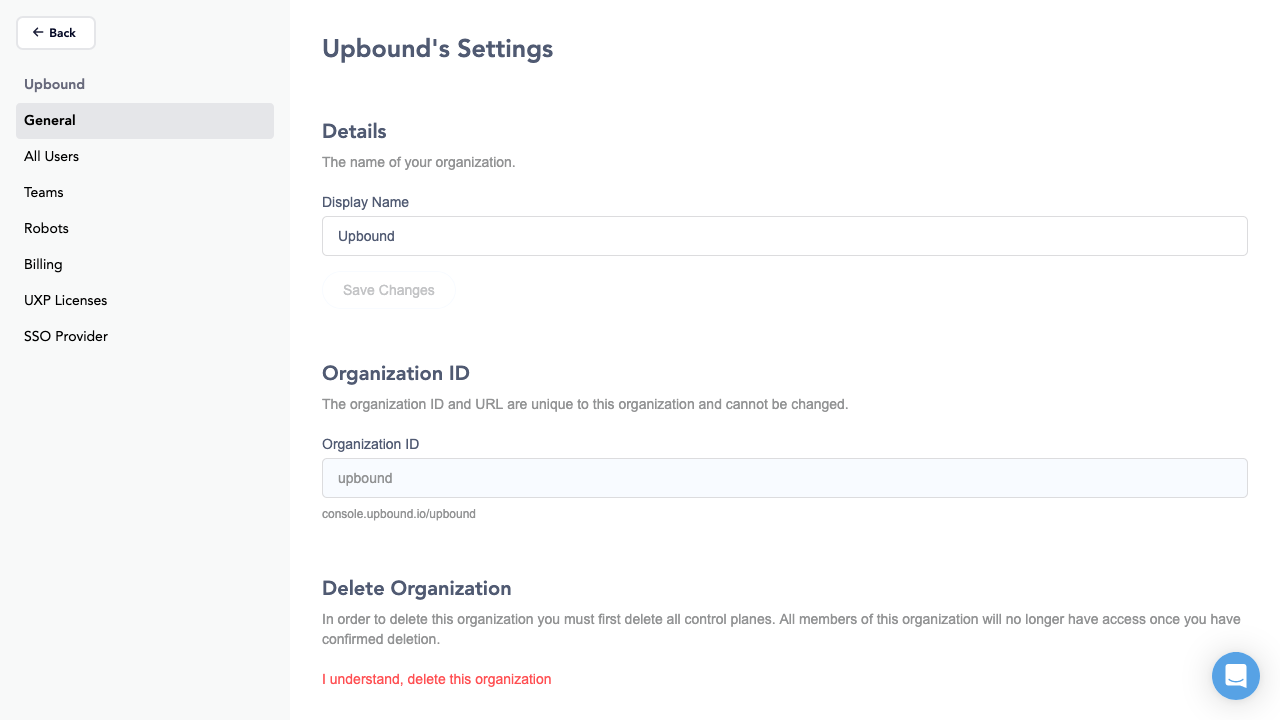
Organization and team management
In the top right dropdown, you can navigate to your organization management settings.
You can create new team members, assign roles, and more.
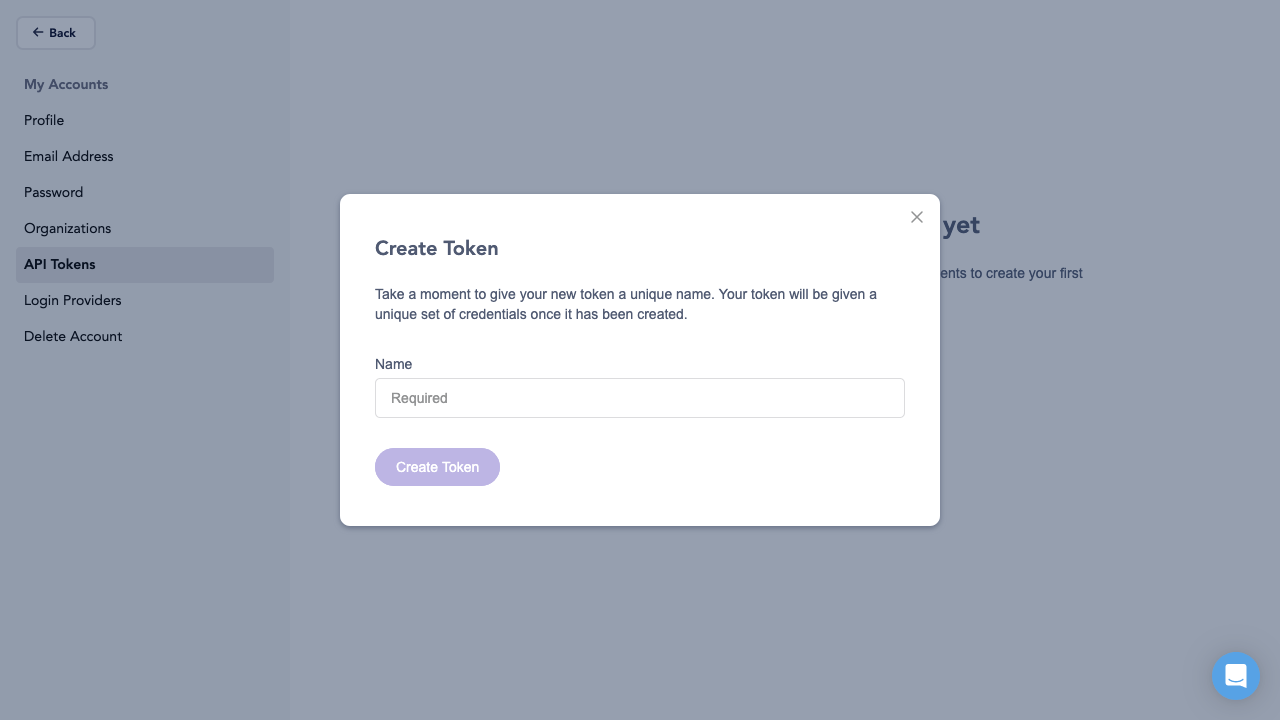
Account management
Clicking on your account profile and selecting Manage Account takes you to your personal account settings.
Create a personal access token
You can create a personal access token (PAT) from the Account Settings view. Select API Tokens in the left-side menu and then select Create New Token. Use personal access tokens to authenticate to Upbound with the up CLI.