What do you do if you need to debug a resource running on an MCP in Upbound? This guide recommends steps for how you can use Upbound’s features to identify the root cause for an issue.
Start from Upbound Console
The Upbound Console has a built-in control plane explorer experience that surfaces status and events for the resources on your MCP. The explorer is claim-based. Resources in this view exist only if they exist in the reference chain originating from a claim. This view is a helpful starting point if you are attempting to debug an issue originating from a claim.
MRs) or Composite Resources (XRs), they will not render in the explorer.Example
The example below uses the control plane explorer view to inspect why a claim for an EKS Cluster isn’t healthy.
Check the health status of claims
From the API type card, two claims branching from of it: one shows a healthy green icon, while the other shows an unhealthy red icon.
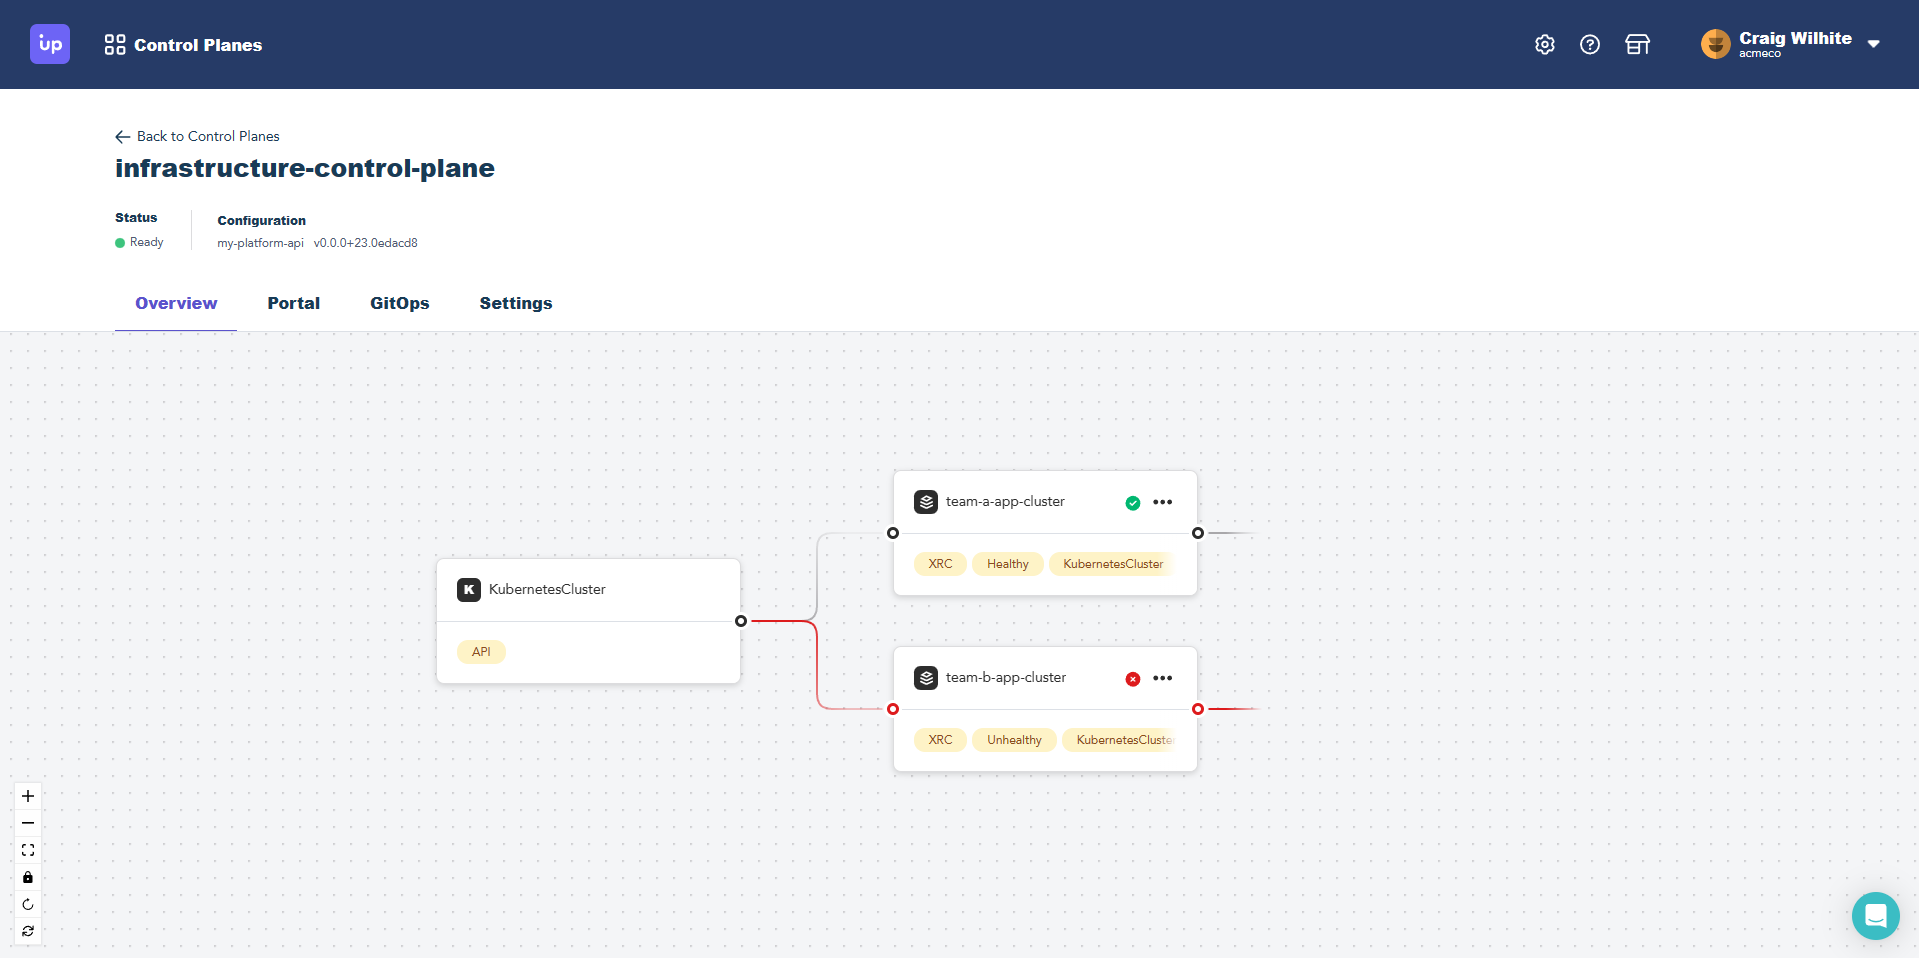
Select More details on the unhealthy claim card and Upbound shows details for the claim.

Looking at the three events for this claim:
ConfigureCompositeResource: this event indicates Upbound created the claimed Composite Resource (
XR).BindCompositeResource: this indicates the Composite Resource (
XR) that’s being “claimed” isn’t ready yet. A claim doesn’t showHEALTHYuntil the XR it references is ready.ConfigureCompositeResource: the error saying,
cannot apply composite resource...the object has been modified; please apply your changes to the latest version and try againis a generic event from Crossplane resources. It’s safe to ignore this error.
Next, look at the status field of the rendered YAML for the resource.
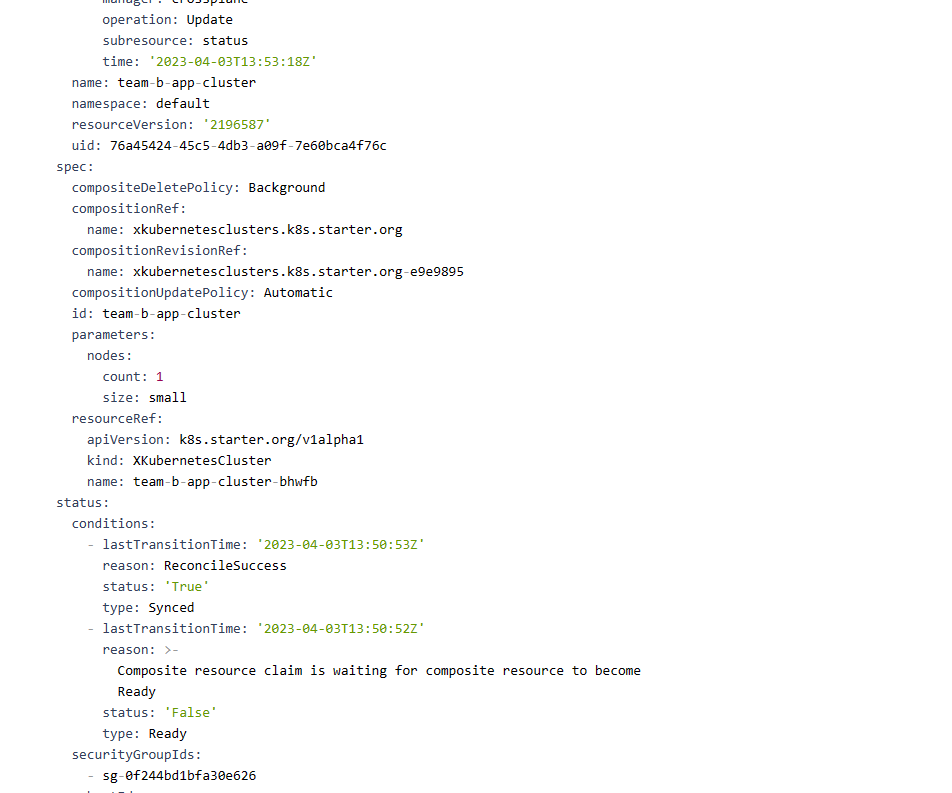
The status reports a similar message as the event stream: this claim is waiting for a Composite Resource to be ready. Based on this, investigate the Composite Resource referenced by this claim next.
Check the health status of the Composite Resource
The control plane explorer only shows the claim cards by default. Selecting the claim card renders the rest of the Crossplane resource tree associated with the selected claim.
The previous claim expands into this screenshot:
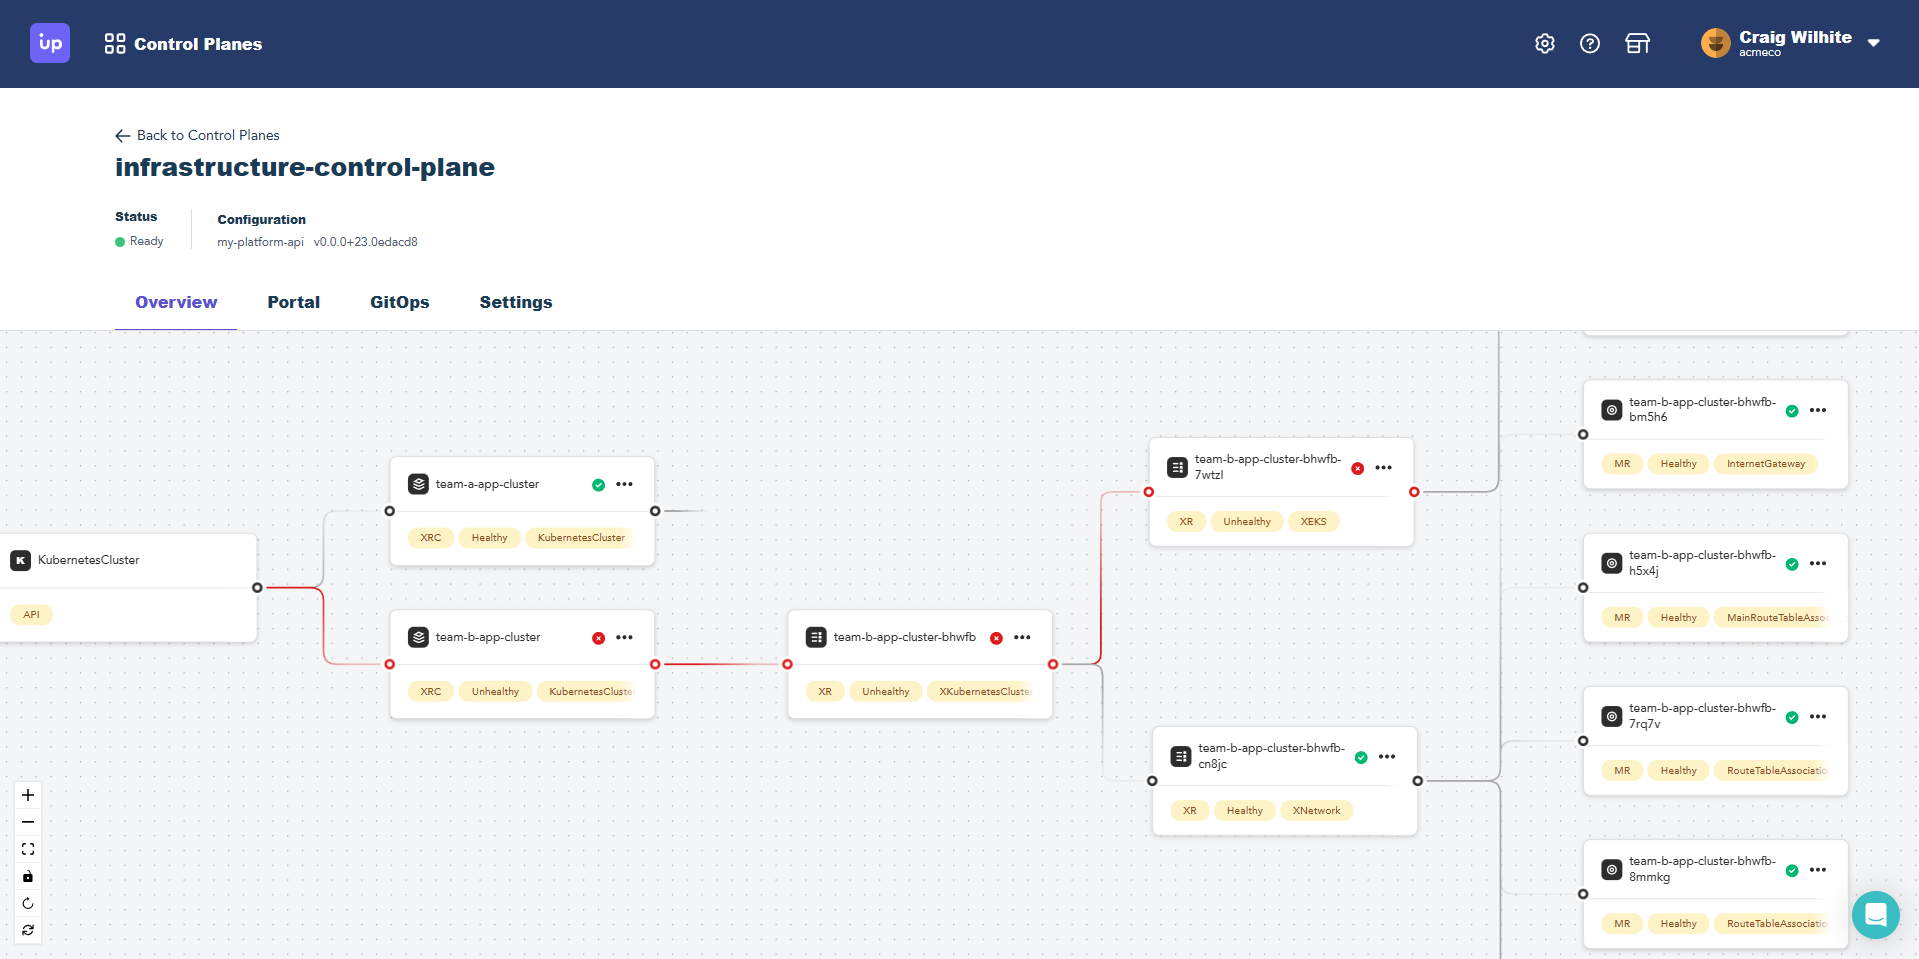
This renders the XR referenced by the claim (along with all its references). You can see the XR is showing the same unhealthy status icon in its card. Notice the XR has itself two nested XRs. One of the nested XRs shows a healthy green icon on its card, while the other shows an unhealthy red icon. Like the claim, a Composite Resource doesn’t show healthy until all referenced resources also show healthy.
Inspecting Managed Resources
Select more details to inspect one of the unhealthy Managed Resources shows the following:
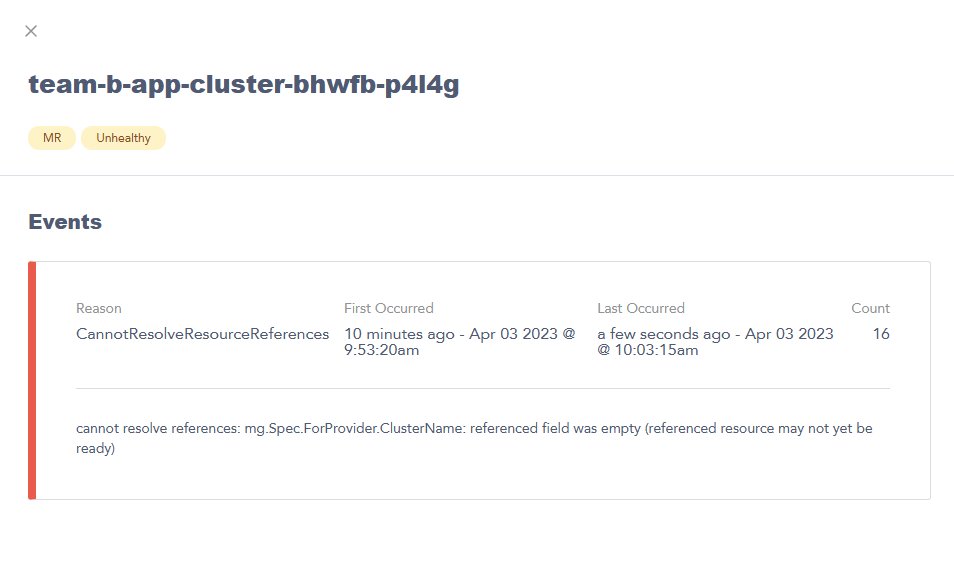
This event reveals it’s unhealthy because it’s waiting on a reference to another Managed Resource. Searching the rendered YAML of the MR for this resource shows the following:

The rendered YAML shows this MR is referencing a sibling MR that shares the same controller. The same parent XR created both of these managed resources. Inspect the sibling MR to see what its status is.

The sibling MR event stream shows the Provider processed the resource create request. Ignore the CannotInitalizeManagedResrouce event. EKS clusters can take 15 minutes or more to provision in AWS. The root cause is everything is fine – all the resources are still provisioning. Waiting longer and then looking at the control plane explorer again, shows all resources are healthy. For reference, below is an example status field for a resource that’s healthy and provisioned.
...
status:
  atProvider:
    id: team-b-app-cluster-bhwfb-hwtgs-20230403135452772300000008
  conditions:
    - lastTransitionTime: '2023-04-03T13:56:35Z'
      reason: Available
      status: 'True'
      type: Ready
    - lastTransitionTime: '2023-04-03T13:54:02Z'
      reason: ReconcileSuccess
      status: 'True'
      type: Synced
    - lastTransitionTime: '2023-04-03T13:54:53Z'
      reason: Success
      status: 'True'
      type: LastAsyncOperation
    - lastTransitionTime: '2023-04-03T13:54:53Z'
      reason: Finished
      status: 'True'
      type: AsyncOperation
Control plane explorer limitations
The control plane explorer view is currently designed around claims (XCs). The control plane explorer doesn’t inspect other Crossplane resources. To inspect other Crossplane resources, use the up CLI.
Some examples of Crossplane resources that require the up CLI
- Managed Resources that aren’t associated with a claim
- Composite Resources that aren’t associated with a claim
- The status of deleting resources
- ProviderConfigs
- Provider events
Use direct CLI access
If your preference is to use a terminal instead of a GUI, Upbound supports direct access to the API server of the managed control plane. Use up ctp kubeconfig get to create a kubeconfig for your managed control plane.